Japanese
News Releases
Site Map
Contact
Home
News Releases
Company
Company
Greeting
Mission & Value
NFC VISION 2030
What We’re Here For
Company profile
Organization chart
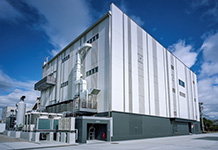
Production sites and research labs
Group companies
Corporate Code of Conduct
Purchase information
History
Products and Business
Products and Business
Beauty care field
Health care field
Fine Chemicals Business
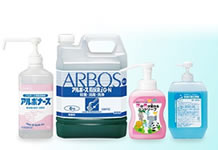
Hygiene field
Phospholipids Special site
Lanolin Cholesterol Business
Perovskite Solar Cells Special site
IR
IR
IR News
IR Schedule
For Individual Investors
Management Policy
Performance and Financial Information
IR Library
Stock Information
Sustainability
Sustainability
Sustainability Organizations
Materialities and our initiatives
Sustainability Report
Basic Management Policy on
Environment, Safety, and Quality
Environment
Occupational Safety
Quality
Japanese
Site Map
Contact
Company
Products and Business
IR
Sustainability
Company
Company list
Greeting
Mission & Value
NFC VISION 2030
What We’re Here For
Company profile
Organization chart
Production sites and research labs
Group companies
Corporate Code of Conduct
Purchase information
History
Products and Business
Product and
business list
Beauty care field
Health care field
Fine Chemicals field
Hygiene field
Phospholipids Special site
Lanolin Cholesterol Business
Perovskite Solar Cells Special site
IR
IR list
Management Policy
For Individual Investors
IR Library
Stock Information
Performance and Financial Information
IR News
IR Schedule
Sustainability
Sustainability list
Sustainability Organizations
Materialities and our initiatives
Sustainability Report
Basic Management Policy on Environment, Safety, and Quality
Environment
Occupational Safety
Quality
HOME
>
IR
>
Performance and Financial Information
Performance and Financial Information
Consolidated Results Highlights
IR
IR News
IR Schedule
For Individual Investors
Management Policy
Top Message
Company profile
Integrated Report
Mid-term Management Plan Presentation
Performance and Financial
Information
Consolidated Results Highlights
IR Library
Consolidated Financial Results
Financial Results Meeting
Stock Information
General Meeting of Shareholders
Dividend and Shareholder Benefit Information
Overview of Shares
Nippon Fine Chemical